SAP Business Analytics Frontends
Quick and solid decisions are the basis for the business success of any company. The comprehensive SAP solution portfolio for Reporting and Analysis provides the opportunity to understand and analyze all business processes as well as the economic correlations. Aided by a central BI solution, company data, even from different sources, becomes meaningful information. This data can be utilized and made available from specialist departments through to management in all areas of the company.
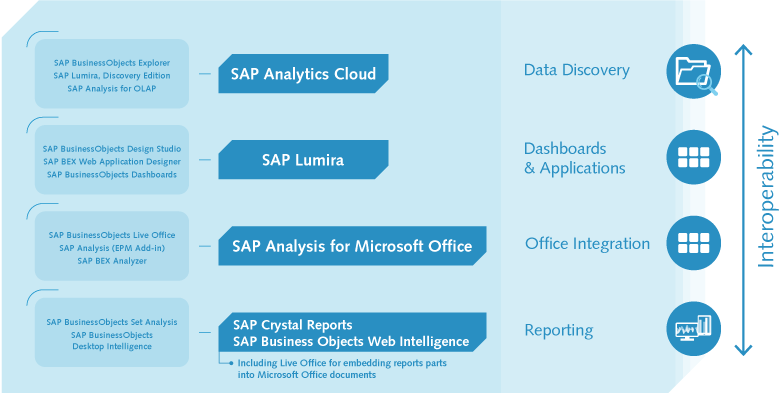
SAP offers frontend tools for four different areas of application: Data analysis, dashboards and applications, office integration and reporting.

Cloud frontends for data analysis
SAP Analytics Cloud – the application for departmental use
The SAP Analytics Cloud (SAC) self-service business analytics tool is far more than “just” a frontend. The Cloud solution integrates Business Intelligence, Augmented and Planning Functions on a single platform. SAC also covers the analysis skills of all well-known SAP frontend tools.
Due to the intuitive usability, the solution is optimally suited for departmental use. The visualization of the complete Cloud application can be accessed anywhere, anytime and with different end devices (laptop, smartphone, tablet).
With direct access to SAP BW/4HANA and SAP BW, analyses of mass data are thereby also displayed in just a few seconds.
With SAP Analytics Cloud (SAC) you can analyze, plan, and calculate forecasts based on your data. For example, analysts can retrieve and visualize data, operational employees can generate reports and record planning data, and financial experts can perform forecasts. The uniform surface allows users quickly find their way around in all areas.
Areas of application:
- Ad-hoc Analyses
- Data Discovery
- Augmented Analytics
Range of functions:
- Searching data, uncovering trends as well as making predictions
- Enriching and combining data from different sources
- Generating dashboards and messages
Target group: Self-service tool for departmental use

On-premises frontends for data analysis
SAP Lumira Discovery
SAP Lumira allows business users to analyze and visualize large volumes of data (Big Data) themselves and to create meaningful reports, even without the support of the IT department. In addition, Lumira Discovery features collaboration tools to share reports easily and quickly.
Areas of application:
- Data Analysis
- Data Discovery
Range of functions:
- Searching data, uncovering trends and finding outliers
- Enriching data, combining data from different sources
- Creating reports
Target group: Self-service tool for business users, analysts and decision makers
Frontend for dashboards and applications
SAP Lumira Designer
Using Lumira Designer, the IT department develops engaging web applications tailored to end users for reporting, dashboards, or for your complete planning applications. Lumira Discovery is used in the business departments for independently creating analyses and reports.
Areas of application:
- Data analysis
- Dashboards and reporting
- Planning applications
Range of functions:
- Powerful, integrated development environment for customer-specific applications
- Numerous control and visualization elements
Target group:
- Developing applications or templates in the IT department
- Reports for business users as well as management


Frontend for Office Integration
SAP Analysis for Microsoft Office
The SAP Analysis for Microsoft Office add-in is a Business Intelligence Software (BI) and allows, without the support of IT, filtering data and identifying trends and outliers directly in Excel. Analysis for Office is an interactive, easy-to-use ad-hoc analysis tool for data from SAP HANA and SAP BW. Reports and data entry screens for planning can thereby be created quickly and dynamically thanks to in-memory technology.
Areas of application:
- Data analysis in Excel
- Data discovery in Excel
Range of functions:
- Data analysis, planning functions, detecting trends and outliers
- Access to data from SAP HANA and SAP BW in Excel
- Generating reports, interactive work and working folders along with BI-controlled live presentations
- All Excel functions can be used
- OLAP Reporting
- Also available as web version
Target group: Self-service tool for business users
Frontends for reporting
SAP BusinessObjects Web Intelligence (SAP Webi)
SAP Webi is an easy-to-use application for creating reports in a browser. Despite its ease of use, SAP BusinessObjects has a high level of functionality. The tool thereby enables all users to get started easily and achieve work results faster.
Without programming, users can generate analysis and formatted reports online in a web browser. Work results are easily distributed within the BI platform or exported to formats such as MS-Excel or PDF.
Areas of application:
- Browser-based analysis tool
Range of functions:
- Generate analyses and formated reports from any data source
- MS-Excel or PDF export
- Ad-hoc reporting
Target group: Self-service tool for business users


SAP Crystal Reports
SAP Crystal Reports is a powerful tool for creating formatted reports. Due to the pixel-precise alignment of texts, tables and graphics, the reports impress with their high presentation quality.
Further strengths of Crystal Reports are the numerous formatting and selection options as well as the deep SAP BW integration.
Areas of application:
- On-premises reporting tool
Range of functions:
- Pixel perfect alignment
- Numerous formatting and selection options
- Mass report distribution in all common formats
Target group:
All users from clerk to management
Portals
Fiori: Complete tasks easily - from anywhere
SAP Fiori is SAP's most innovative interface technology. The core component of the SAP Fiori concept is to provide users with relevant information at the "right" time. Fiori is characterized by short navigation paths and displays that are reduced to the essentials. Therefore, the SAP Fiori concept meets all requirements of a modern reporting system.
SAP Fiori Launchpad for Analytics
The SAP Fiori Launchpad is the logical successor to the NetWeaver BI portal in the analytics environment. In addition, Fiori combined with S/4HANA is the central entry point to business processes and analytics along your company's entire value chain. The fast response times, the numerous integration options, the simple operation, and the appealing design with short access paths characterize the contemporary character of this end user portal.


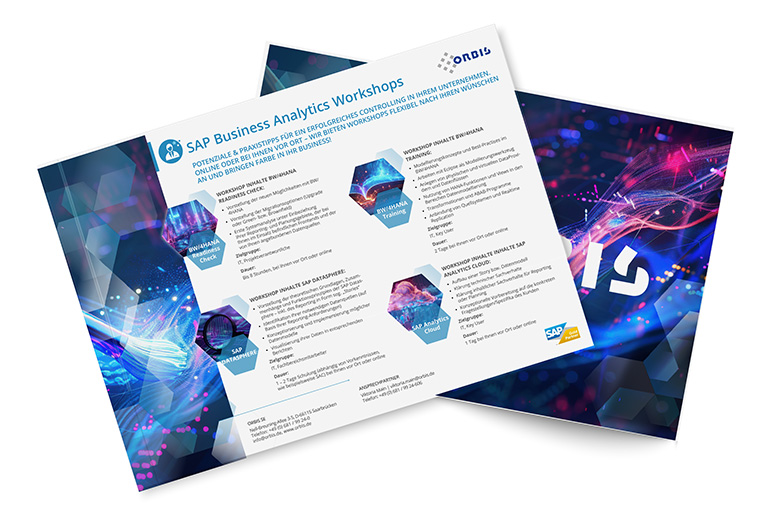
In our fee-based workshops, we work with you to determine your specific needs and develop individual options and opportunities for your company. What’s more, you’ll receive handy hints on the various Business Analytics components too.

I’m here to help you
Viktoria Main
(Account Manager)
Tel.: +49 681 9924 606
E-Mail: Viktoria.Main(at)orbis.de


